TABLE OF CONTENTS
- Step 1: Import Data from Precoro
- Step 2: Transform Data in Power BI
- Step 3: Build Your Reports and Dashboards
After setting up the connection, follow the steps below to load and customize your data for reporting.
Step 1: Import Data from Precoro
To import data from Precoro:
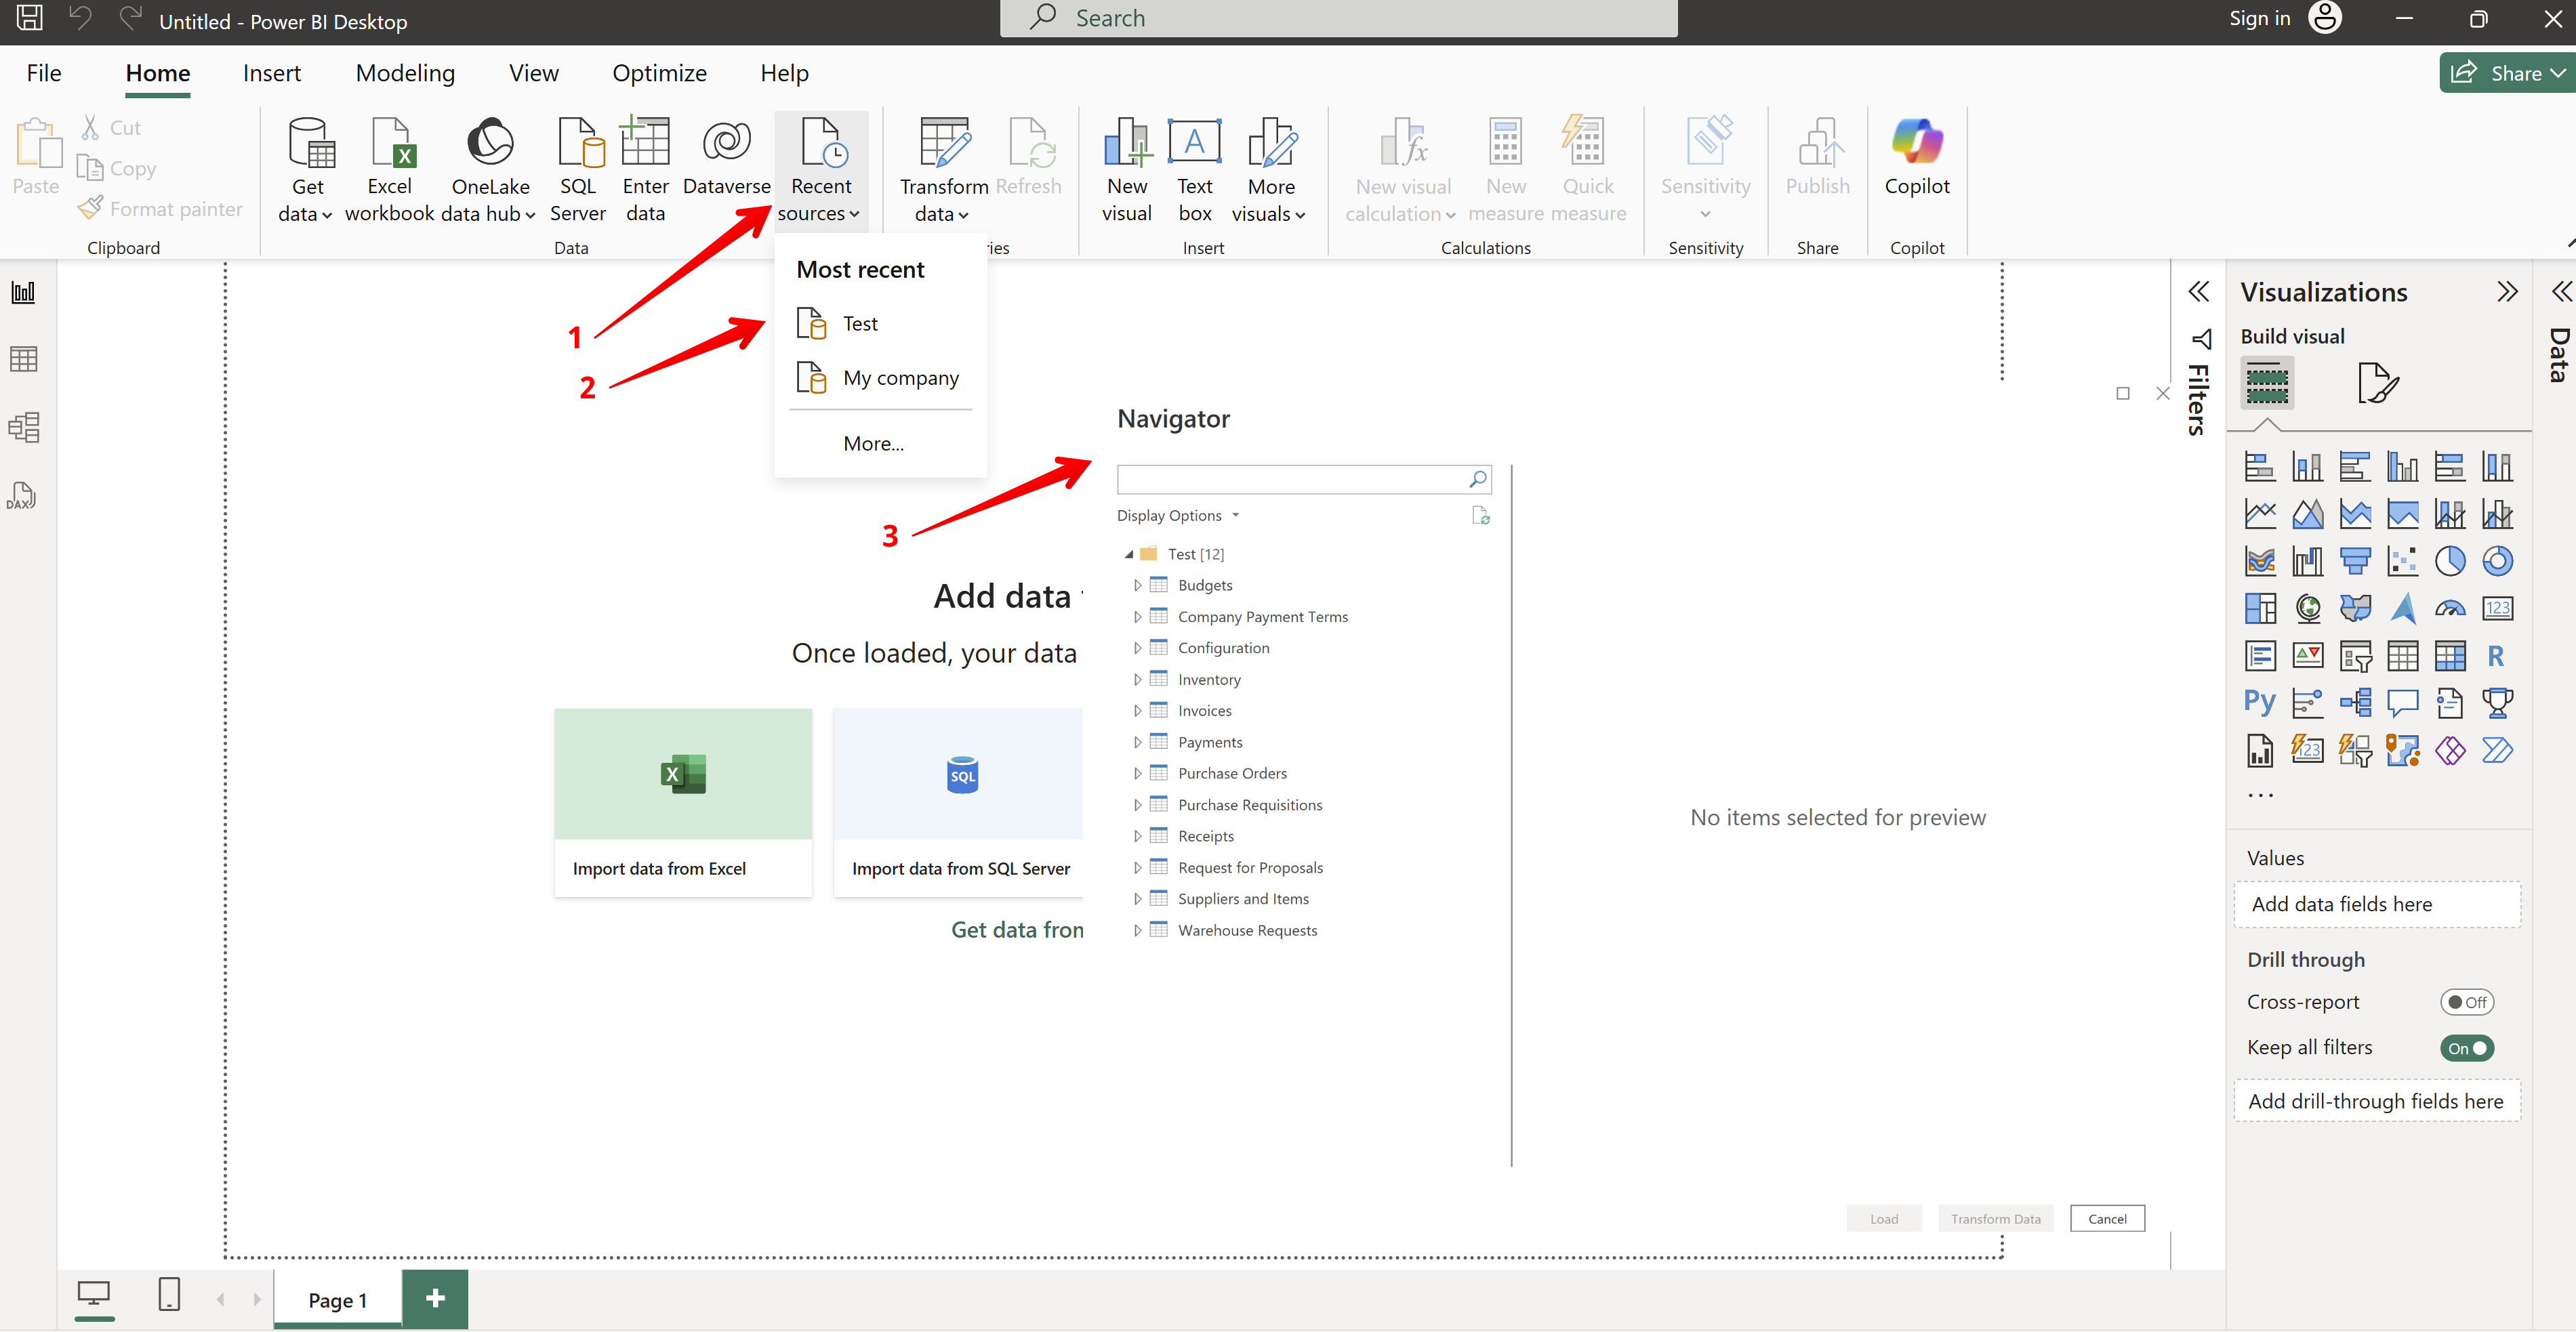
- Select the needed company from the Recent sources dropdown to open the Navigator window in Power BI.
If you want to add a new company at this step, click Get data and follow the steps from this guide. The Navigator window will open after the successful connection.
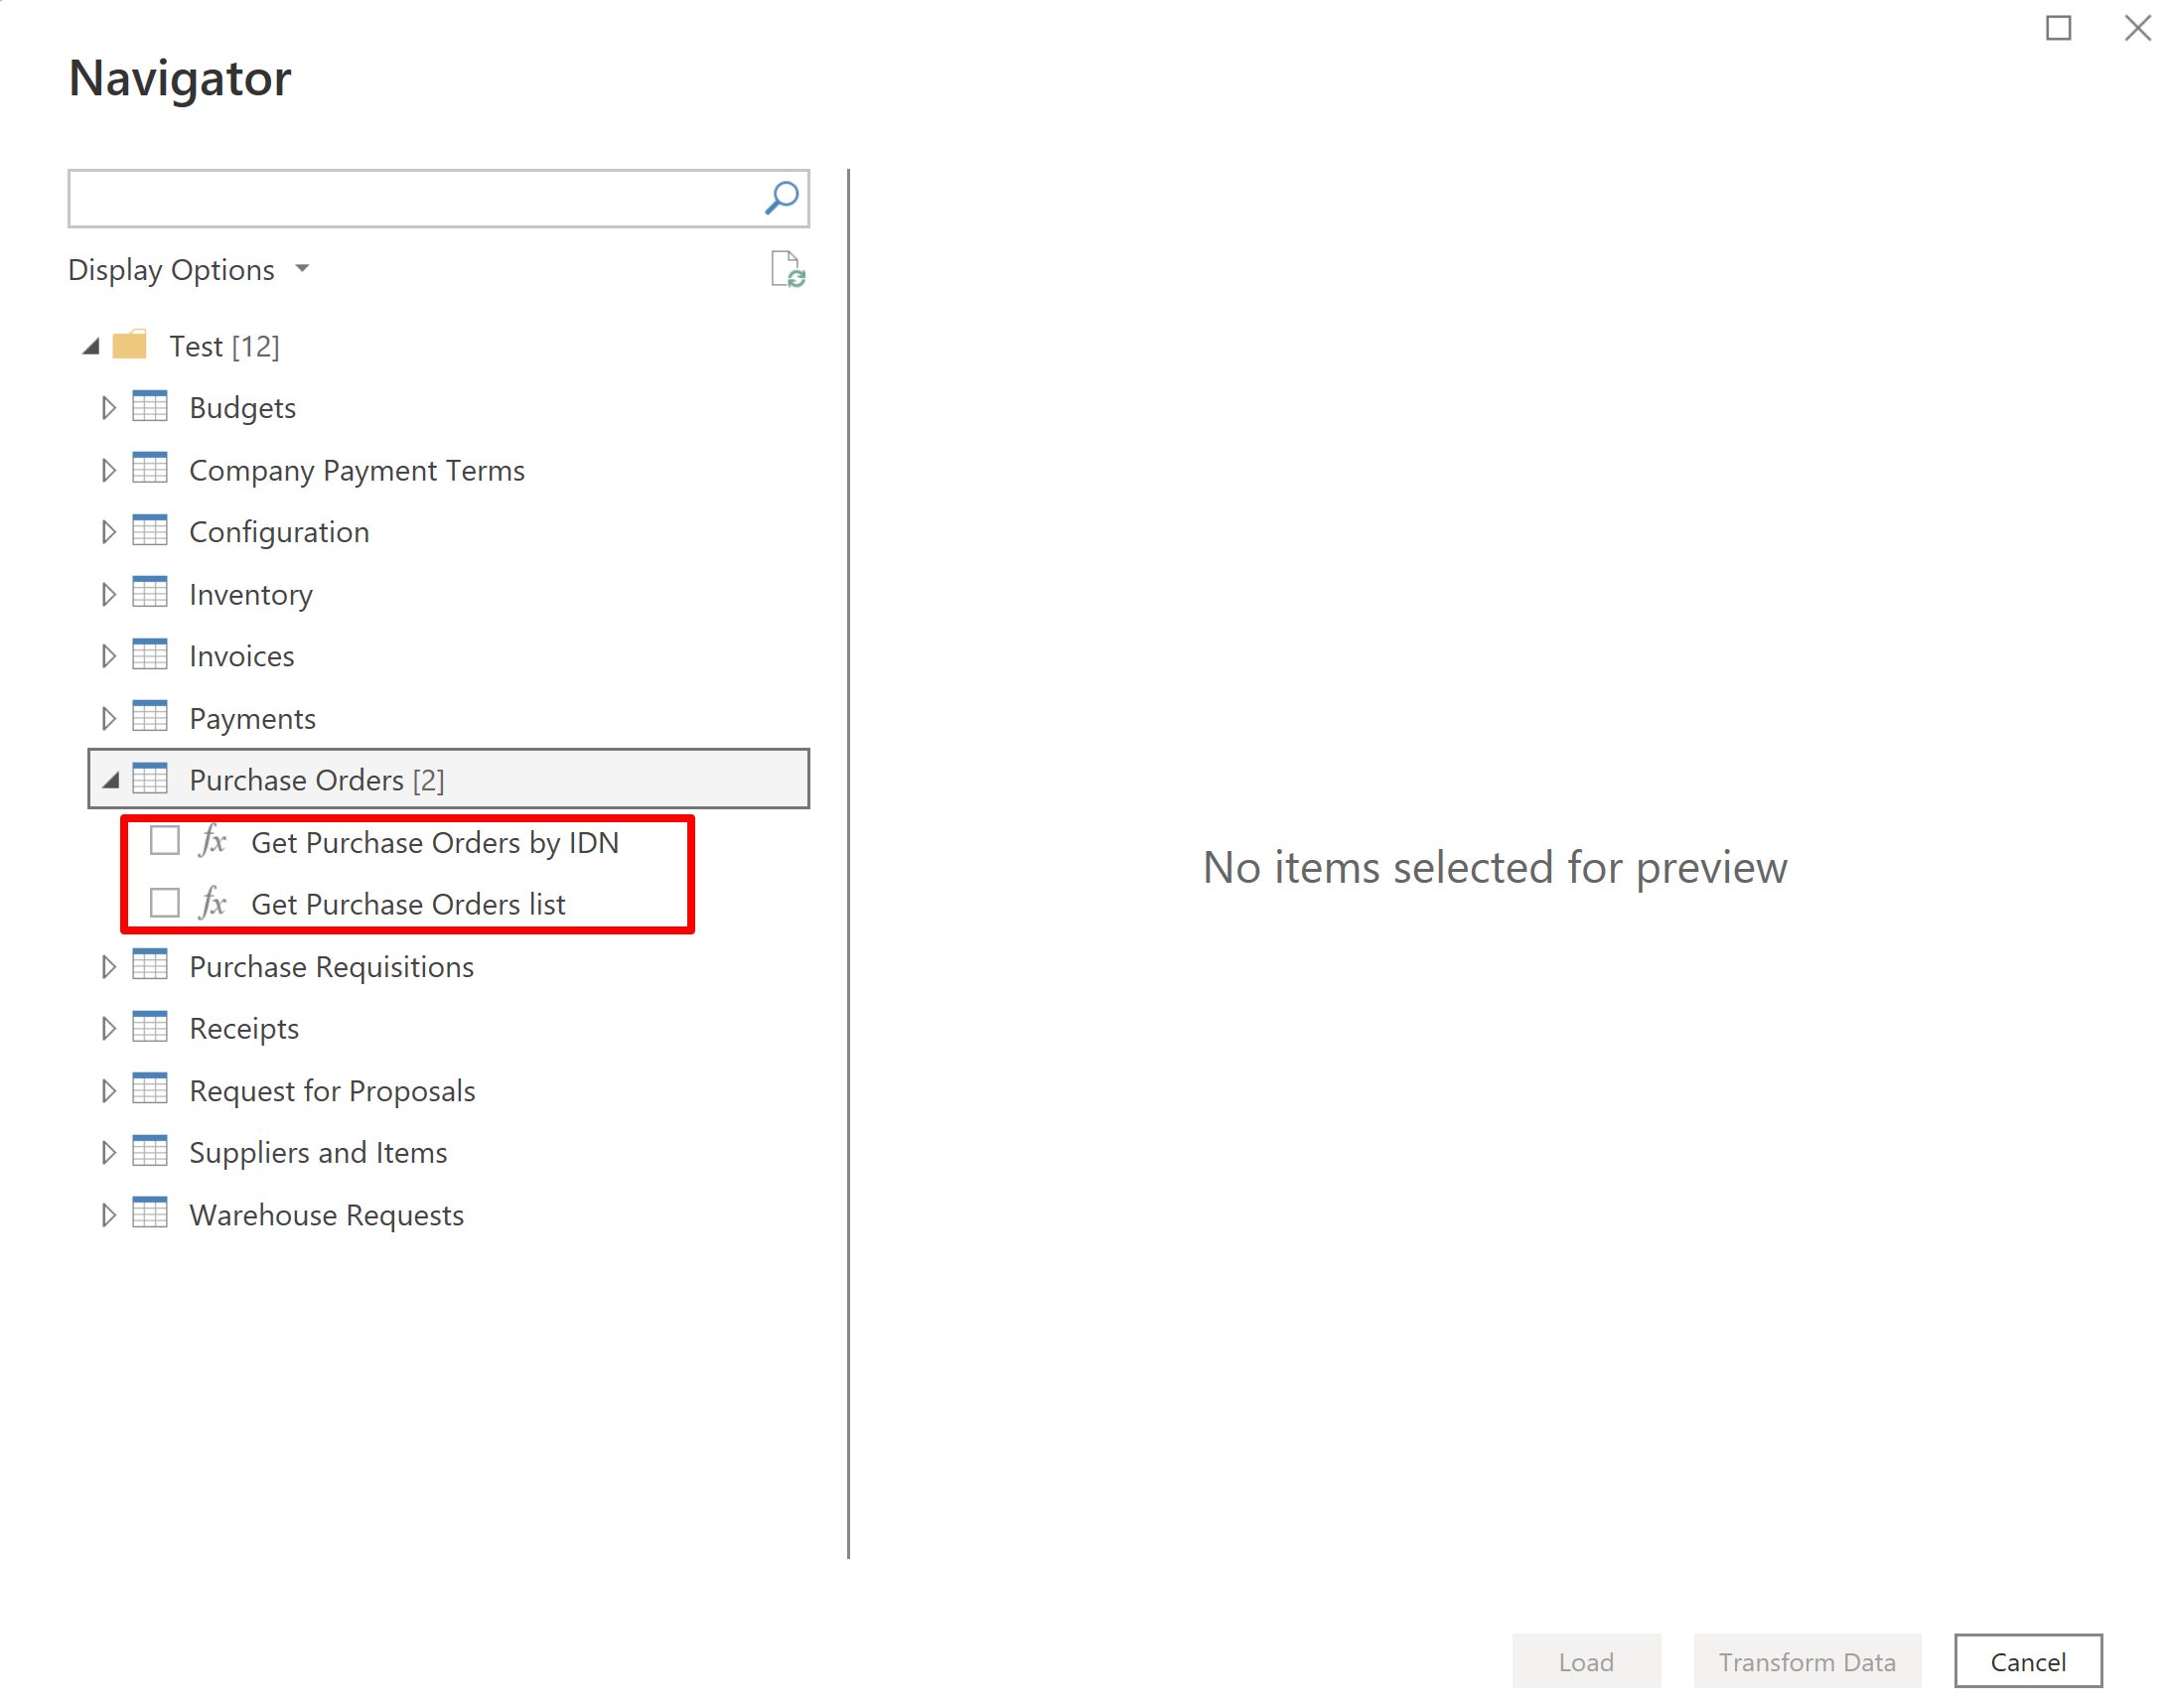
- Select the tables you want to load into the Query Editor by checking the appropriate boxes.
Each object in Precoro has two table representations:
- By IDN: Includes item-specific details and allows filtering by custom fields for items (CFIs).
- By list: Provides general document information without item-specific details and is limited to custom fields for documents (CFDs).

3. Implement additional parameters (optional):
- Set the date range using createDate[left_date] and createDate[right_date] fields.
If createDate[left_date] is not set, all historical data will be loaded by default.
If createDate[right_date] is not set, today’s date will be used.
💡Please note: Leave createDate[right_date] blank for automated data refresh.
- Include_DocumentCustomFields/Include_Items_CustomFields: Choose “TRUE” or “FALSE” to include or exclude additional custom field columns. You will be able to decompose them and retrieve codes and names for all used custom field options divided by levels.
The resulting data table always contains other default CFDs and CFIs named dataDocumentCustomFields and dataItemsCustomFields. These fields will be loaded to the result table whether you set a “TRUE” or “FALSE” value and will contain only a set of custom field options IDs.
💡Please note: CFD and CFI parameters affect the connector’s productivity, so when you do not need them to be included in tables, set “FALSE” to speed up the data processing time.
- cnt_preview_pages: Displays the number of pages loaded using the by-list method for preview. If not set, one page is loaded by default.
- cnt_preview_IDNs: Shows the number of integrated IDNs from the preview pages. If not set, the first five results are shown by default.
- modifiedSince: Filter and download only those documents that have been created or edited since a specific date.
4. Click Apply to save parameters and Load to complete the import process.
Step 2: Transform Data in Power BI
In the Home section, click Transform Data to open the Query Editor. It may take a moment, depending on the size of your database and the tables you select.
Here, you can:
- Filter the list of columns based on what you need to build your reports.
- Provide additional data adjustments and formatting depending on your needs.
- Unfold columns with nested data. These columns contain objects of Record or List types. To unfold them into additional columns (for Records) and rows (for Lists), click on the corresponding button next to the column name.
Check the detailed instructions on working with List and Record data types here.
Step 3: Build Your Reports and Dashboards
Once all adjustments are made, click Close&Apply and return to the report builder.
Check the Building Reports and Dashboards in Power BI article to see an example of a report you can build using the Precoro data.